Dr. Tom Introduction
An Advanced and Intuitive Multi-omics Data Visualisation System for Efficient Analysis and Discovery
Dr. Tom is a web-based solution for the convenient analysis, visualisation and interpretation of all types of RNA data, including mRNA, miRNA and lncRNA. Single cell RNA-seq data and WGBS data can also be interpreted by Dr. Tom.
Designed by a team of expert scientists and bioinformaticians at BGI with collective experience across thousands of research projects, Dr. Tom provides a wide range of intuitive and interactive data visualisation tools specifically designed to save you time in your differential expression or pathway analysis research.
In addition, powerful analysis tools and advanced algorithms allow you to mine your data to gain new insight and more value beyond standard available RNA analysis services.
Data from many of the world’s leading databases have been integrated into the Dr. Tom system allowing users to reference and cross check all results and findings.
Dr. Tom is already relied upon by tens of thousands of scientists and researchers, and has shown itself to be a valuable and important tool in addition to any institution’s own internal data curation and analysis efforts. To learn more, email us for a no obligation discussion about access.
Core Capabilities
Expression Analysis
Dr. Tom’s detailed, interactive heatmap functionality can be used to quickly identify genes that are commonly regulated. With simple point-and-click action, data can be selected and manipulated to show clusters under different pathways.
 Gene Set Enrichment Analysis
Dr. Tom accesses both free and licensed KEGG databases to allow users to conveniently and quickly find statistically significant trends in the large lists of genes generated by many functional genomics techniques and bioinformatics analyses approaches.
Reference Ontological Information Across Multiple Databases
Dr. Tom is able to reference multiple-databases for association analysis, including TCGA, NCBI and many more. This allows a user to quickly and conveniently view comprehensive ontological information for any gene of interest, including annotation, sequences, expression level, and a list of relevant published papers.
 Custom Datasets
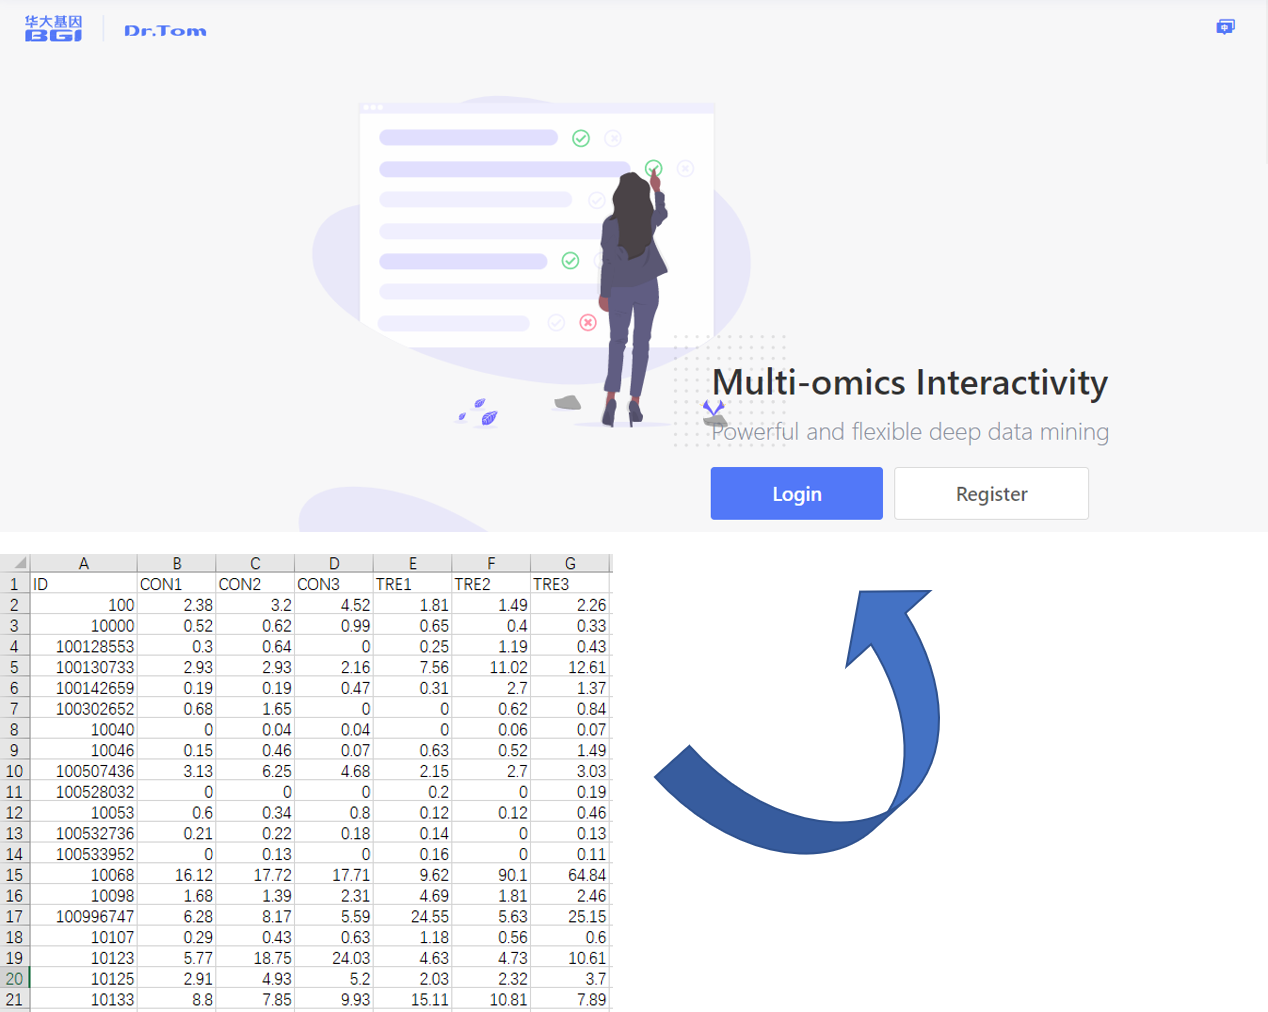
Customers can upload their own gene expression data or FASTQ files, using tool boxes for graphing and visualisation, and construct their own gene annotation database for enrichment, clustering and multi-omics association analysis.
Free On-Demand Webinar
Register for and view on-demand our webinar introducing Dr. Tom with a live demonstration of the system.
Register here, it's quick and easy.
Or, read our user example below:
The researchers wanted to study the mechanism of poor prognosis of chidamide and MI-3 (hereinafter referred to as C and M) inhibitors for synergistic treatment of mixed leukemia (MLL) gene recombination. They utilized multiple Dr. Tom analysis functions to help answer several questions key to their paper. Some of these questions and how they were answered are listed below.
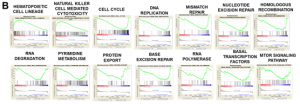
1. The researchers wanted to know what are the pathways for change after processing?
KEGG enrichment analysis showed that when C and M were combined, the most significant pathways were cell cycle, DNA replication, and repair pathways.
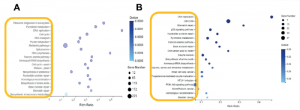
2. The researchers wanted to know which treatment effect is more obvious and causes the above pathways change?
GSEA analysis further showed that the vast majority of these changes originated from C, not M (Figure 2B is processed by C).
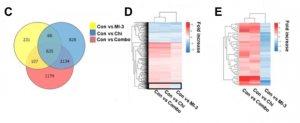
3. The researchers wanted to know what is the intersection of differentially expressed genes under each treatment?
Venn diagrams of differential genes under different treatments, 635 genes were expressed under all three treatments (Figure 3C).
They also wanted to learn are these genes up / down regulated consistently across treatments?
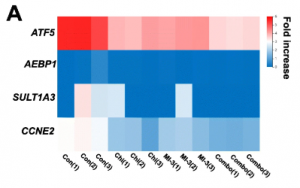
Clicking on the center of the graph shows the gene set, and a heat map is shown. 59 genes showed different trends (shown in the box in Figure 3D). M treatment was down-regulated and C treatment or M + C treatment was up-regulated. The researchers then wanted to screen out the genes with different trends, as above.
By selecting the box on the map, the relevant gene set is shown, and a heat map generated. The heat map (Figure 3E) corroborates the result of point 2.
4. The researchers wanted to know what is the function of the genes shown in the previous step?
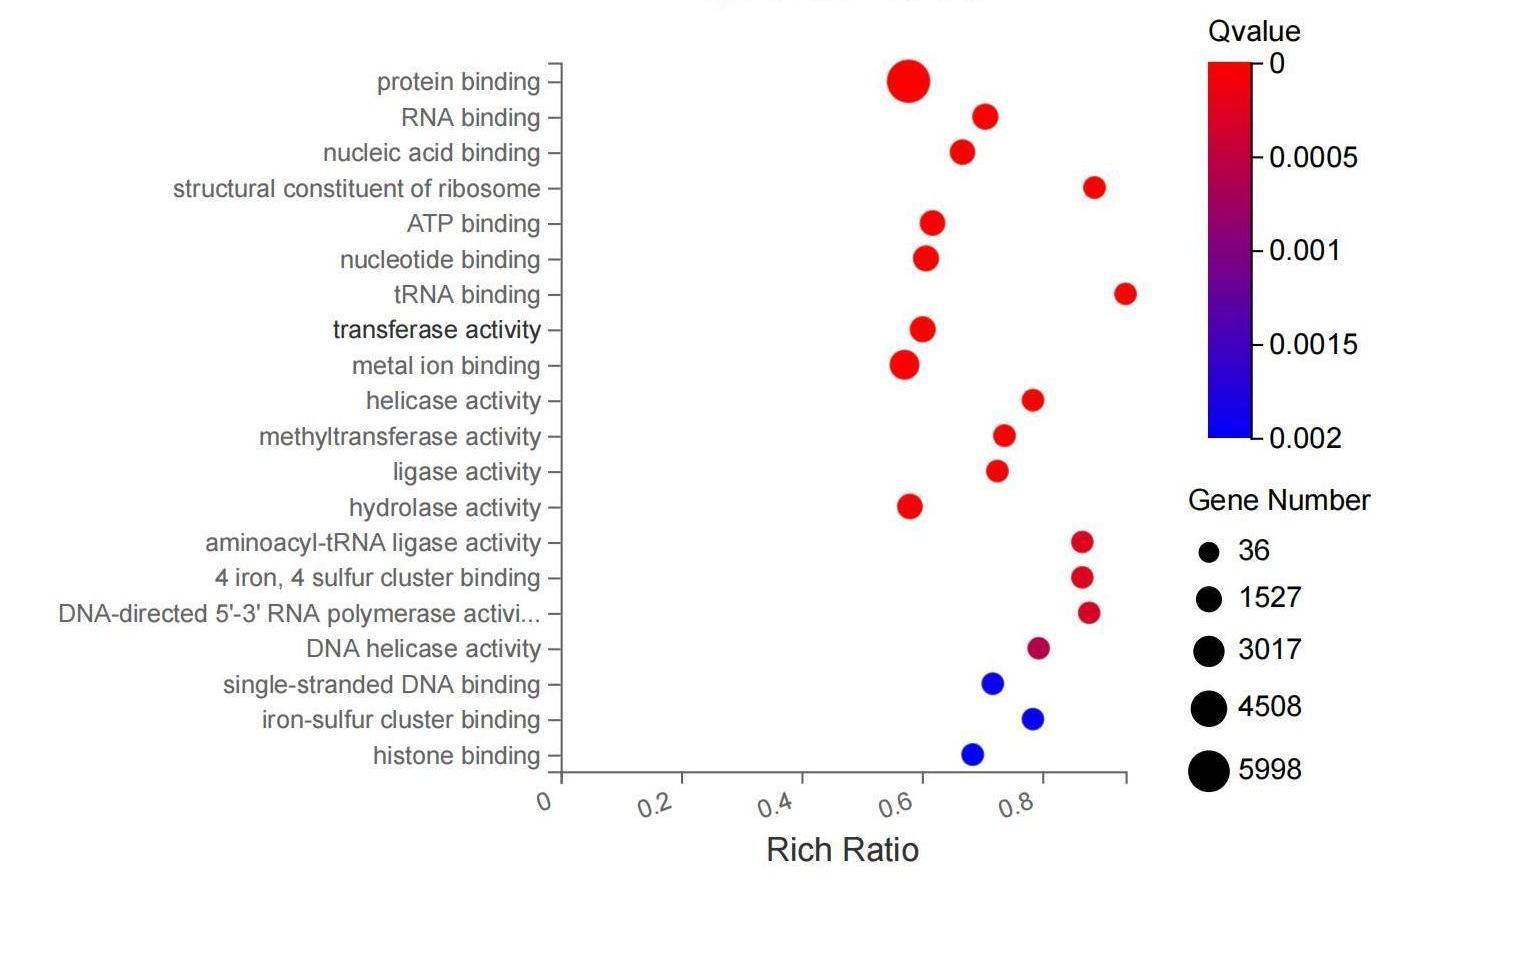
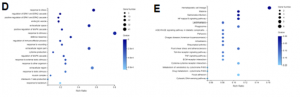
GO and KEGG analysis (Figures 4D and E) found that these genes are involved in key survival signaling pathways, cytokine pathways necessary for inflammatory responses.
5. The researchers wanted to continue to screen for other key genes.
They selected different groups of expressions, adjusted the filtering conditions, and generated a heat map(figure 5A).