DESCRIPTION
SPECIFICATION
RESOURCES
Service Description
BGI Genomics lipidomics profiling services are designed to obtain a lipid profile and screen for differentially-expressed lipids in the sample. BGI has extensive experience in the field of lipidomics profiling with developed reliable workflows using market leading technologies and an advanced bioinformatics infrastructure¹.
Lipidomics Profiling
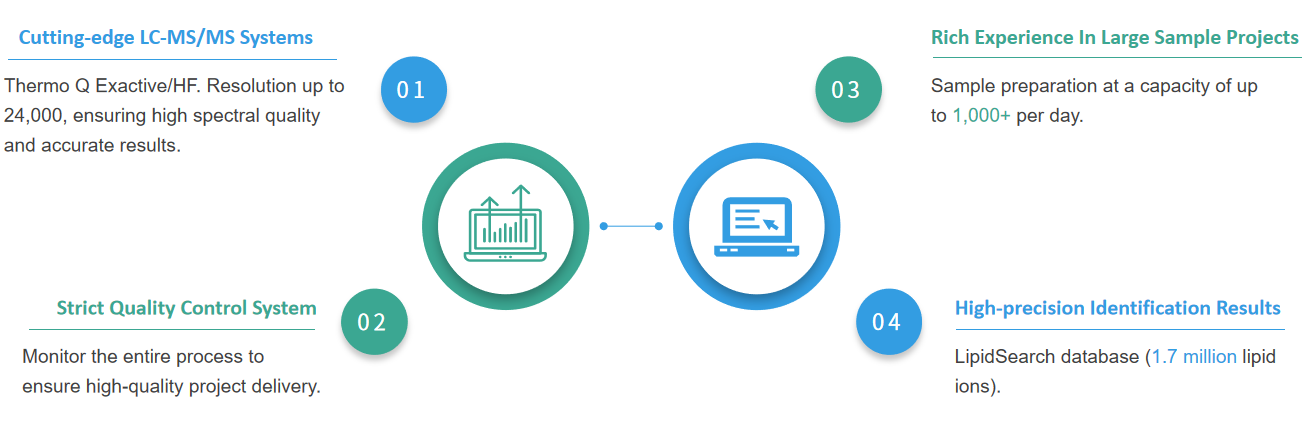
Combined with LipidSearch software and advanced algorithm analysis, BGI's lipidomics profiling service enables confirmation of lipid structure characteristics such as lipid molecule head structure, fatty acid branch chain length and unsaturated double bond number by comparing the characteristic signals of precursor ions, MS2 fragments and neutral loss. LipidSearch is equipped with the largest lipids database, covering 8 categories of lipids, 300 lipid subclasses, and containing more than 1.7 million lipid ions and their predictive fragment ions information.
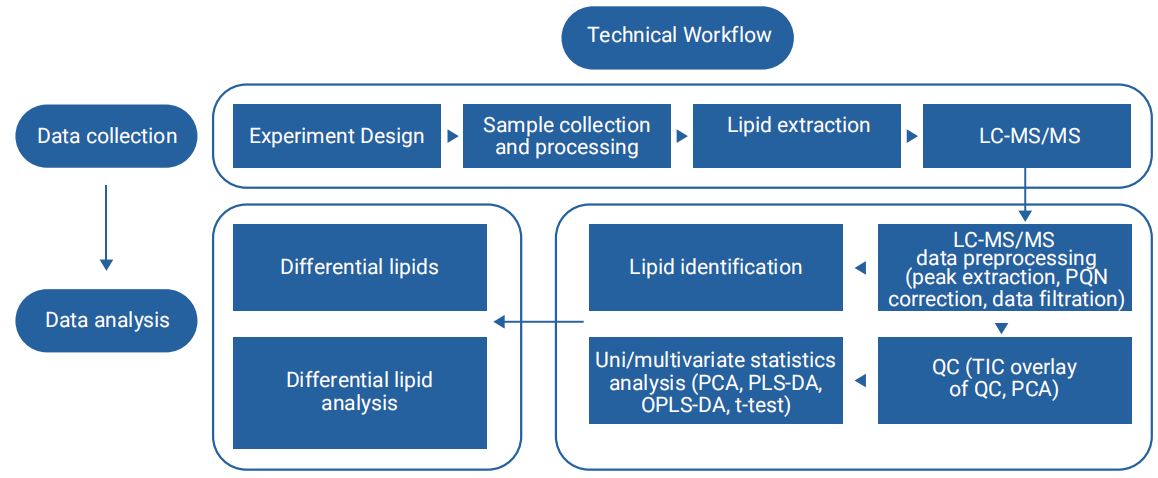
Project Workflow
References
[1] Zhong H, et al., Lipidomic profiling reveals distinct differences in plasma lipid composition in healthy, prediabetic, and type 2 diabetic individuals. Gigascience, 2017 07 01; 67(7). doi:10.1093/gigascience/gix036.
How to order

Mass Spectrometry Service Specification
Lipidomics Profiling services are performed using Waters ACQUITY UPLC and cutting-edge mass spectrometer (Q Exactive HF/HF-X).

Sample Preparation and Services
- Increase metabolome depth of coverage using ACQUITY UPLC CSH C18 column
- (+) and (-) ESI detection by a Q Exactive HF/HF-X mass spectrometer

Quality Standard
- Summary includes all methods and data analysis
- Reports provided in Excel or PDF format; RAW files available upon request

Turn Around Time
- Typical 5-7 weeks after sample receipt for raw data delivery
Sample Requirements
We accept metabolite samples in a variety of formats. Contact your BGI account representative for details for your samples.
| SAMPLE TYPE | RECOMMENDED SAMPLE AMOUNT | MINIMUM SAMPLE AMOUNT |
|---|---|---|
| Serum, plasma | ≥ 300 µL | ≥ 100 µL |
| Urine | ≥ 300 µL | ≥ 100 µL |
| Animal and clinical tissues | ≥ 200 mg | ≥ 25 mg |
| Feces and intestinal contents | ≥ 200 mg | ≥ 25 mg |
| Cell | 1×10^7 | 5×10^6 |
| Microorganism | ≥ 200 mg | ≥ 25 mg |
| Culture medium, fermentation medium | ≥ 1 mL | ≥ 100 µL |
| Milk | ≥ 1 mL | ≥ 100 µL |
| Other body fluids (amniotic fluid, saliva, hemolymph, cerebrospinal fluid, etc.) | ≥ 300 µL | ≥ 100 µL |
DATA ANALYSIS
- Data analysis performed with metaX1 and BGI library
- T-test, PCA, PLS-DA, OPLS-DA for differential metabolic identification
- Cluster analysis
- Metabolite pathway annotation
- ROC analysis
- Metabolite correlation analysis
